Blog · November 10, 2026 · 9 min read
Where Local Businesses Face the Most Competition: The 50 Largest US Metros, Ranked
By Kasen Sansonetti, founder of Wetware Labs
Key findings
- Miami is the most crowded market for local service businesses among the 50 largest US metros, followed by Tampa and Denver, according to Wetware Labs' analysis of 2023 Census Bureau data.
- Memphis has the fewest local service businesses per resident of the 50, well behind Houston and San Antonio.
- Four Florida metros rank in the top ten: Miami, Tampa, Orlando and Jacksonville.
- Roofing shows the widest gap between metros: Denver has one roofing company with employees for every 6,152 residents, Las Vegas one for every 45,275.
- Kansas City, where we're based, ranks 20th of 50.
Every owner we work with eventually asks me some version of the same question: how crowded is my market? For a long time my honest answer was a shrug and a list of competitors from Google Maps. That isn't an answer, so we counted.
We used the Census Bureau's newest business counts to measure how many local service businesses there are per resident in the 50 largest US metros, across twelve trades and professions people search for every day: plumbers, electricians, roofers, dentists, lawyers and more. That's 545,306 businesses in metros home to 185 million people.
Keep one picture in mind while you read. Local search is musical chairs. Google's map shows three businesses, and an AI assistant names a handful. The number of chairs is the same in every city. What changes is how many people are walking around them.
By the end you'll know where your metro ranks, which trades are most crowded where, and what to do this week if yours is a crowded one.
Which metros are the most crowded?
For each of the twelve industries, we ranked the 50 metros by businesses per 10,000 residents, then averaged each metro's standing across all twelve. We call the result the Local Competition Index. A score of 100 would mean a metro has the most businesses per resident in every industry; 0 would mean the fewest in every one.
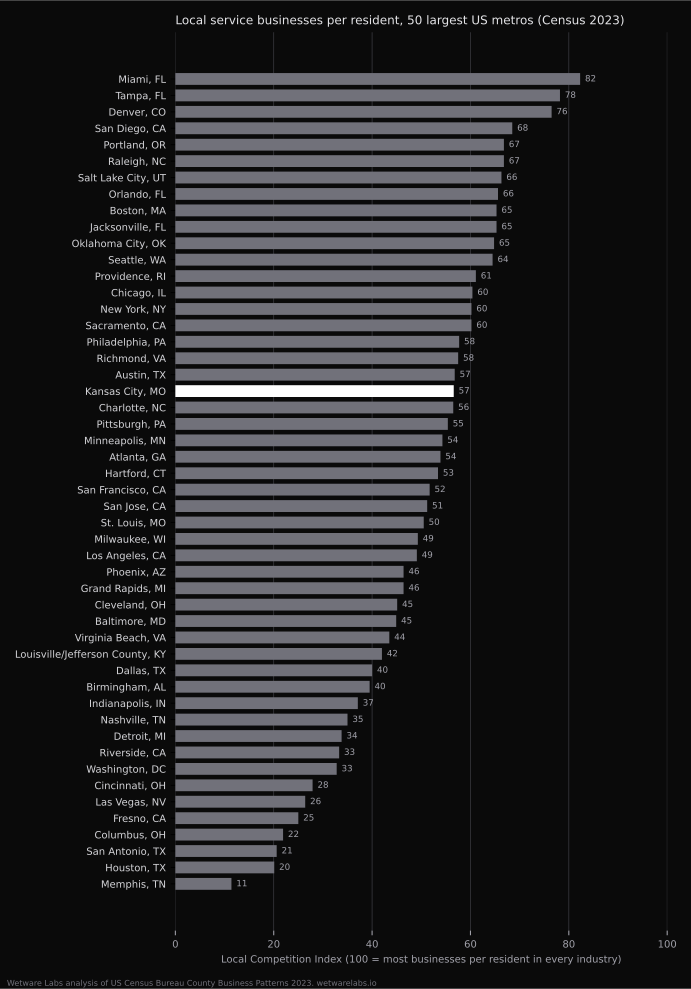
Miami leads, and Florida puts four metros in the top ten. Memphis sits at the bottom, far behind the next-lowest metro, Houston. Metros with equal scores share a rank.
Same three chairs in every one of these cities. Miami just has the most people circling them.
| Rank | Metro area | Index |
|---|---|---|
| 1 | Miami-Fort Lauderdale-West Palm Beach, FL | 82.3 |
| 2 | Tampa-St. Petersburg-Clearwater, FL | 78.2 |
| 3 | Denver-Aurora-Centennial, CO | 76.5 |
| 4 | San Diego-Chula Vista-Carlsbad, CA | 68.5 |
| 5 | Portland-Vancouver-Hillsboro, OR-WA | 66.8 |
| 5 | Raleigh-Cary, NC | 66.8 |
| 7 | Salt Lake City-Murray, UT | 66.3 |
| 8 | Orlando-Kissimmee-Sanford, FL | 65.6 |
| 9 | Boston-Cambridge-Newton, MA-NH | 65.3 |
| 9 | Jacksonville, FL | 65.3 |
| 11 | Oklahoma City, OK | 64.8 |
| 12 | Seattle-Tacoma-Bellevue, WA | 64.5 |
| 13 | Providence-Warwick, RI-MA | 61.1 |
| 14 | Chicago-Naperville-Elgin, IL-IN | 60.4 |
| 15 | New York-Newark-Jersey City, NY-NJ | 60.2 |
| 15 | Sacramento-Roseville-Folsom, CA | 60.2 |
| 17 | Philadelphia-Camden-Wilmington, PA-NJ-DE-MD | 57.7 |
| 18 | Richmond, VA | 57.5 |
| 19 | Austin-Round Rock-San Marcos, TX | 56.8 |
| 20 | Kansas City, MO-KS | 56.6 |
| 21 | Charlotte-Concord-Gastonia, NC-SC | 56.5 |
| 22 | Pittsburgh, PA | 55.4 |
| 23 | Minneapolis-St. Paul-Bloomington, MN-WI | 54.3 |
| 24 | Atlanta-Sandy Springs-Roswell, GA | 53.9 |
| 25 | Hartford-West Hartford-East Hartford, CT | 53.4 |
| 26 | San Francisco-Oakland-Fremont, CA | 51.7 |
| 27 | San Jose-Sunnyvale-Santa Clara, CA | 51.2 |
| 28 | St. Louis, MO-IL | 50.5 |
| 29 | Milwaukee-Waukesha, WI | 49.3 |
| 30 | Los Angeles-Long Beach-Anaheim, CA | 49.1 |
| 31 | Phoenix-Mesa-Chandler, AZ | 46.4 |
| 31 | Grand Rapids-Wyoming-Kentwood, MI | 46.4 |
| 33 | Cleveland, OH | 45.1 |
| 34 | Baltimore-Columbia-Towson, MD | 44.9 |
| 35 | Virginia Beach-Chesapeake-Norfolk, VA-NC | 43.5 |
| 36 | Louisville/Jefferson County, KY-IN | 42.0 |
| 37 | Dallas-Fort Worth-Arlington, TX | 40.0 |
| 38 | Birmingham, AL | 39.5 |
| 39 | Indianapolis-Carmel-Greenwood, IN | 37.1 |
| 40 | Nashville-Davidson-Murfreesboro-Franklin, TN | 35.0 |
| 41 | Detroit-Warren-Dearborn, MI | 33.8 |
| 42 | Riverside-San Bernardino-Ontario, CA | 33.3 |
| 43 | Washington-Arlington-Alexandria, DC-VA-MD-WV | 32.8 |
| 44 | Cincinnati, OH-KY-IN | 27.9 |
| 45 | Las Vegas-Henderson-North Las Vegas, NV | 26.4 |
| 46 | Fresno, CA | 25.0 |
| 47 | Columbus, OH | 21.9 |
| 48 | San Antonio-New Braunfels, TX | 20.6 |
| 49 | Houston-Pasadena-The Woodlands, TX | 20.1 |
| 50 | Memphis, TN-MS-AR | 11.4 |
Which trades are most crowded where?
The overall index hides big swings inside single trades. For roofing, painting, law and pest control, the most crowded metro has more than six times as many businesses with employees per resident as the least crowded one.
| Industry | Most per resident | Fewest per resident | Gap |
|---|---|---|---|
| Beauty salons | Pittsburgh, PA: 1 per 2,285 residents | Fresno, CA: 1 per 9,861 | 4.3x |
| Chiropractors | Minneapolis, MN: 1 per 4,055 residents | Memphis, TN: 1 per 16,549 | 4.1x |
| Dentists | San Jose, CA: 1 per 1,255 residents | Memphis, TN: 1 per 3,402 | 2.7x |
| Electricians | Boston, MA: 1 per 2,740 residents | Memphis, TN: 1 per 6,149 | 2.2x |
| General auto repair | Pittsburgh, PA: 1 per 3,014 residents | Memphis, TN: 1 per 6,323 | 2.1x |
| Landscapers | Providence, RI: 1 per 1,485 residents | Houston, TX: 1 per 7,055 | 4.7x |
| Lawyers | Miami, FL: 1 per 741 residents | Riverside, CA: 1 per 4,776 | 6.5x |
| Painters | Portland, OR: 1 per 4,054 residents | Memphis, TN: 1 per 26,809 | 6.7x |
| Pest control | Miami, FL: 1 per 9,836 residents | Minneapolis, MN: 1 per 61,024 | 6.4x |
| Plumbing, heating and air conditioning contractors | Providence, RI: 1 per 2,187 residents | Columbus, OH: 1 per 4,814 | 2.2x |
| Roofers | Denver, CO: 1 per 6,152 residents | Las Vegas, NV: 1 per 45,275 | 7.4x |
| Veterinarians | Oklahoma City, OK: 1 per 7,482 residents | Fresno, CA: 1 per 17,401 | 2.4x |
Take roofing. Denver has one roofing company with employees for every 6,152 residents. Las Vegas has one for every 45,275. A roofing company in Denver is going after the same three spots on the map as one in Las Vegas, with about seven times as many competitors per resident.
A few of these have obvious stories, and we'll label them as our read rather than findings. Denver and Oklahoma City, the two metros with the most roofing companies per resident, both sit in hail country. Pest control is a Florida business: Miami, Tampa and Jacksonville lead, and Minneapolis, with its long winters, has the fewest. Winter is the cheapest exterminator. And Miami has one law office with employees for every 741 residents, more than six times the rate in Riverside.
What does a crowded market mean for search?
Here's our read. When more people circle the same chairs, the tiebreakers decide who sits down. For the map, the biggest ones are the primary category on your Google Business Profile, your reviews, and the same name, phone and hours on every site that lists you. For AI answers, add other sites that mention you and a Bing Places listing, since Microsoft's Copilot searches the web through Bing.
None of that is advanced. It's the basics, done completely. In a market like Miami, finishing them only gets you into the game, because your competitors have finished them too. In a thinner market like Memphis, the same basics can win a chair quickly, because fewer competitors have bothered.
The research on how AI answers and searches that end without a click change what those basics are worth is in our local SEO and AI search statistics for 2026.
What would change our mind: these counts include only businesses with paid employees, so a one-person roofing crew isn't in them, and in some metros those crews are a big share of the market. Businesses per resident is also not the same as demand. A metro full of second homes or visitors has more customers than residents. If you know your trade's market differently, we'd like to hear it.
Where does Kansas City land?
We're based in Kansas City, so we looked closer. It ranks 20th of 50 overall, right in the middle of the pack. Here is every trade.
| Industry | KC rank of 50 | KC: one business per |
|---|---|---|
| Chiropractors | 3 | 5,269 residents |
| Veterinarians | 11 | 8,639 residents |
| Roofers | 13 | 10,925 residents |
| Lawyers | 20 | 1,840 residents |
| Pest control | 20 | 20,079 residents |
| Painters | 21 | 7,988 residents |
| Landscapers | 22 | 2,653 residents |
| Electricians | 26 | 4,294 residents |
| Plumbing, heating and air conditioning contractors | 28 | 3,367 residents |
| Dentists | 31 | 2,538 residents |
| General auto repair | 34 | 4,586 residents |
| Beauty salons | 38 | 4,422 residents |
What can you do about it this week?
- Find your row. Open the CSV below, find your metro and your trade, and note your rank and the "one business per so many residents" figure.
- Count the chairs. Search your main service and your town on your phone and write down the three businesses in the map. Then ask ChatGPT, Gemini and Copilot who they would recommend, and write down those names too.
- Compare. For each of those businesses, note the primary category on their Google profile, their rating, their review count, and whether the phone and hours match their website. Do the same for yourself.
- Fix the gaps in order. Primary category first. Then the same name, phone and hours on Google, Bing Places, Apple Business Connect, Facebook and Yelp. Then reviews: ask every happy customer, and answer every review.
- Get mentioned. A trade association directory, a supplier's "where to buy" page, a local sponsorship. Other sites naming you is what AI answers repeat.
If your trade is in a top-ten metro, plan on all five, every month. If it's in the bottom ten, steps 3 and 4 alone may get you a chair.
How we did it
- Businesses: US Census Bureau, County Business Patterns 2023 (released 2025), which counts establishments with paid employees in the pay period including March 12, 2023.
- Residents: US Census Bureau, Vintage 2024 population estimates, using each metro's July 1, 2023 figure.
- Metros: the 50 largest metropolitan statistical areas by 2023 population, as defined by the Office of Management and Budget in 2023. The smallest of the 50 is Hartford, CT, with 1.16 million people.
- Industries (NAICS 2017 codes): plumbing, heating and air conditioning contractors (238220), electricians (238210), roofers (238160), painters (238320), landscapers (561730), pest control (561710), general auto repair (811111), beauty salons (812112), dentists (621210), chiropractors (621310), veterinarians (541940) and lawyers (541110).
- Index: within each industry, metros are ranked by businesses per 10,000 residents and the rank is turned into a 0 to 100 score; the index is the average of the twelve scores.
- Limits: businesses without employees are not counted. An establishment is a location, so a company with five shops counts five times. Metro areas include their suburbs and some rural counties.
Download the data
The data is free to use with credit under a Creative Commons Attribution 4.0 license.
- Index by metro (CSV): rank, metro, population, index, and businesses per 10,000 residents for each industry.
- Every metro and industry (CSV): counts, per-resident rates and ranks.
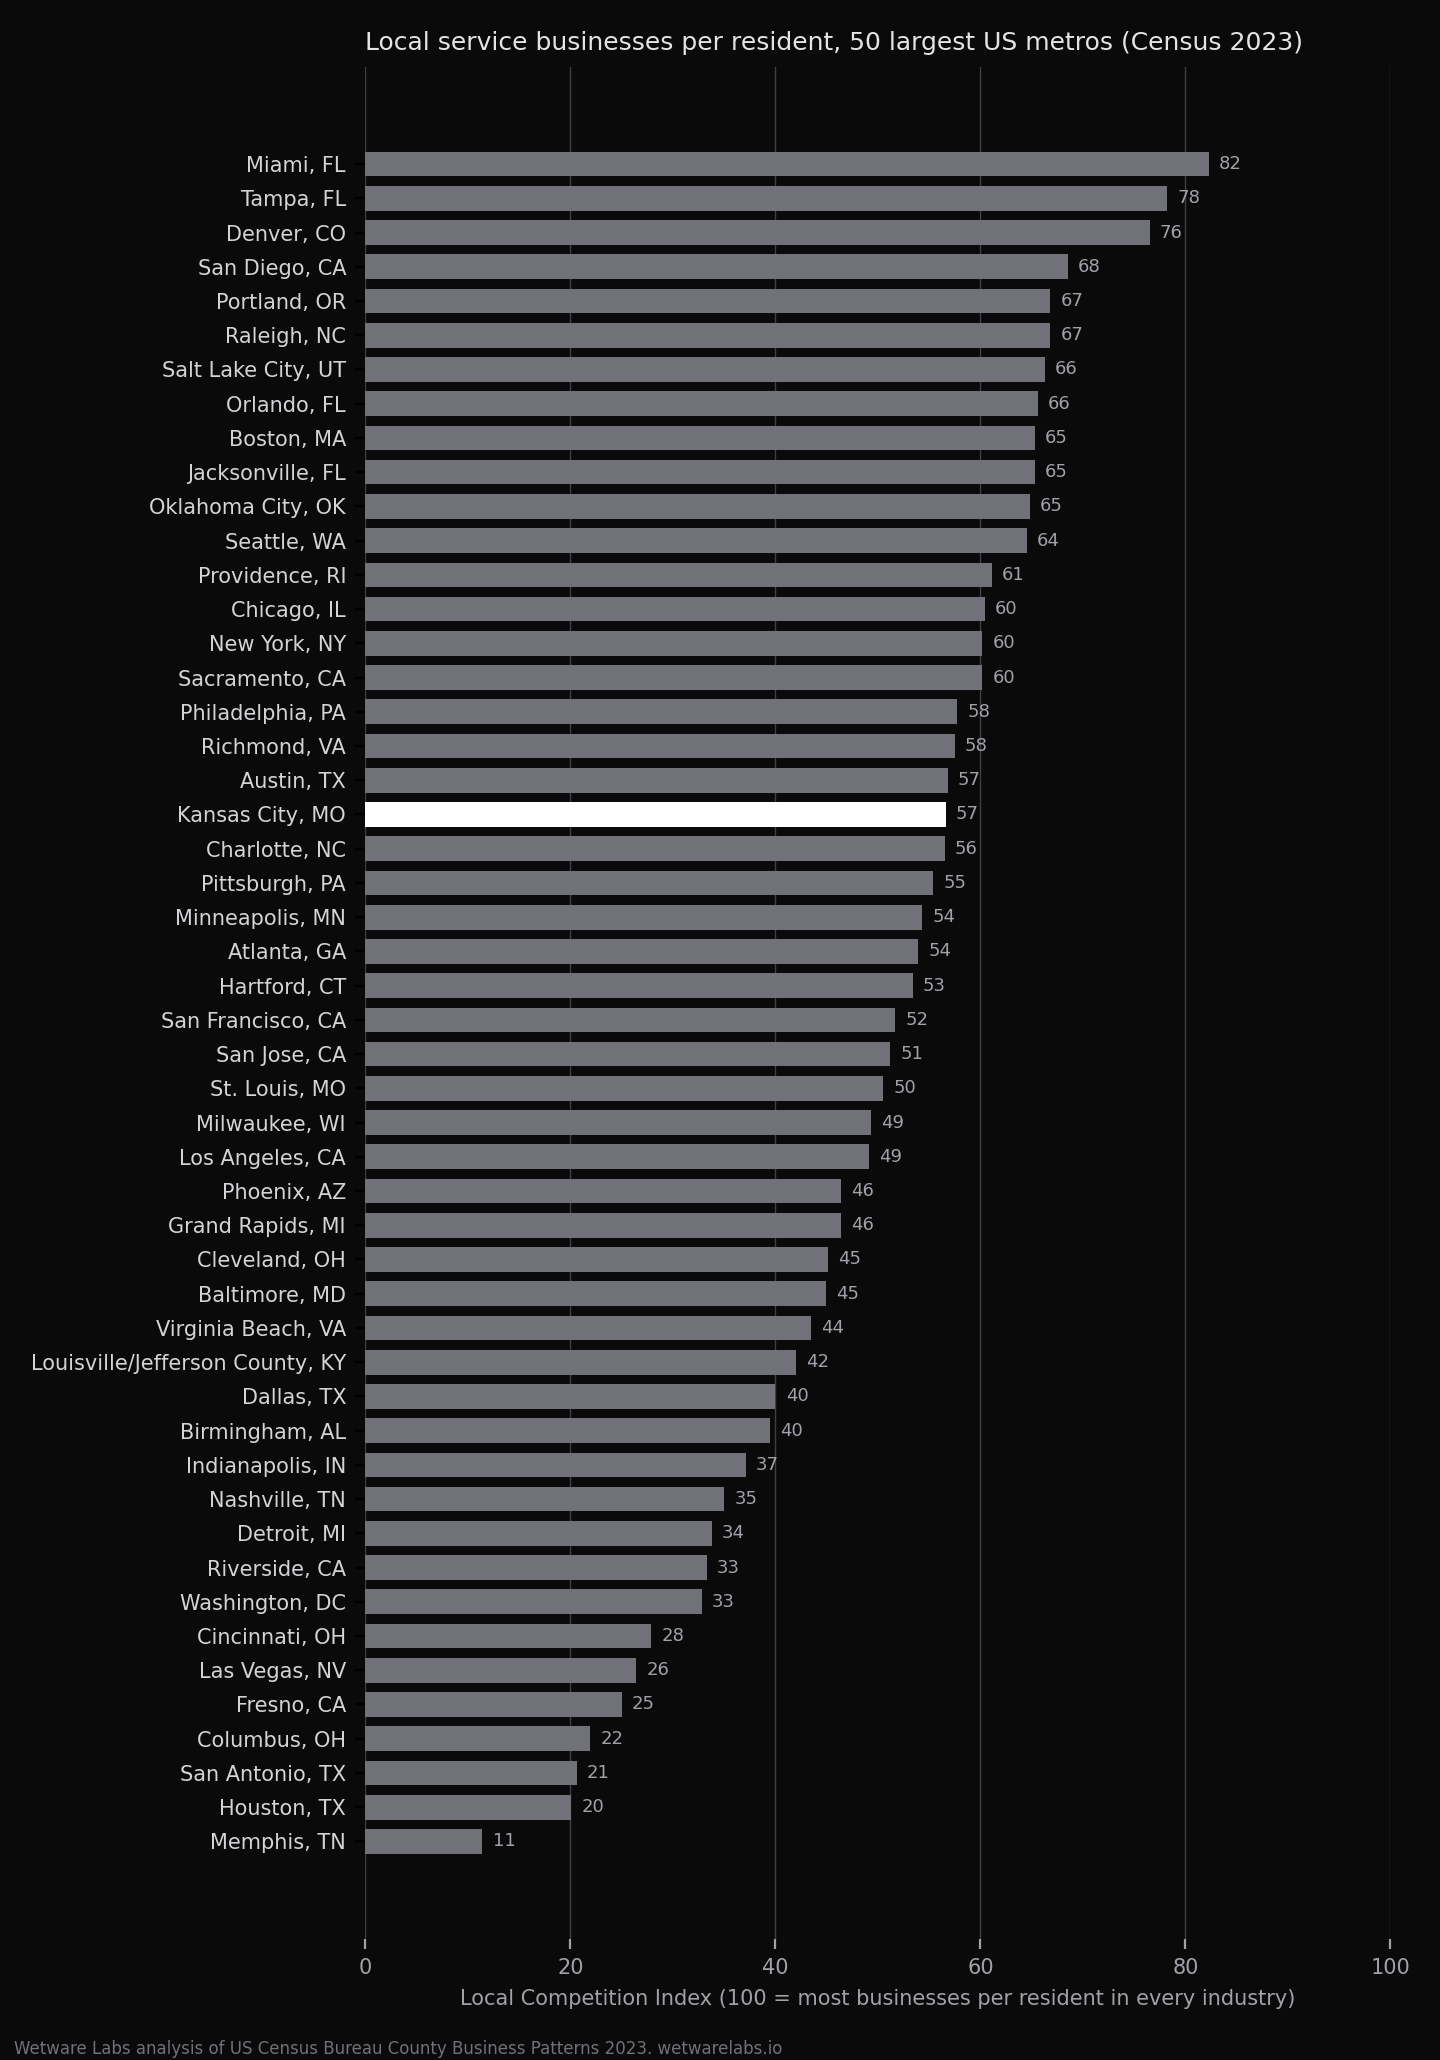
- The chart (PNG)
Cite this data: Wetware Labs, Local Competition Index (November 2026), from US Census Bureau County Business Patterns 2023. https://wetwarelabs.io/blog/local-business-competition-by-metro
Reporters: if you want the numbers for your metro or a trade we didn't cover, email kasen@wetwarelabs.io and we'll run it.
If you're in a crowded market and want to know which chair you're closest to, that's what our SEO audits measure.